Graph rational functions
Learning Outcomes
- Graph a rational function using intercepts, asymptotes, and end behavior.
- Write a rational function given intercepts and asymptotes.
 When the degree of the factor in the denominator is even, the distinguishing characteristic is that the graph either heads toward positive infinity on both sides of the vertical asymptote or heads toward negative infinity on both sides.
 For example the graph of [latex]f\left(x\right)=\dfrac{{\left(x+1\right)}^{2}\left(x - 3\right)}{{\left(x+3\right)}^{2}\left(x - 2\right)}[/latex].
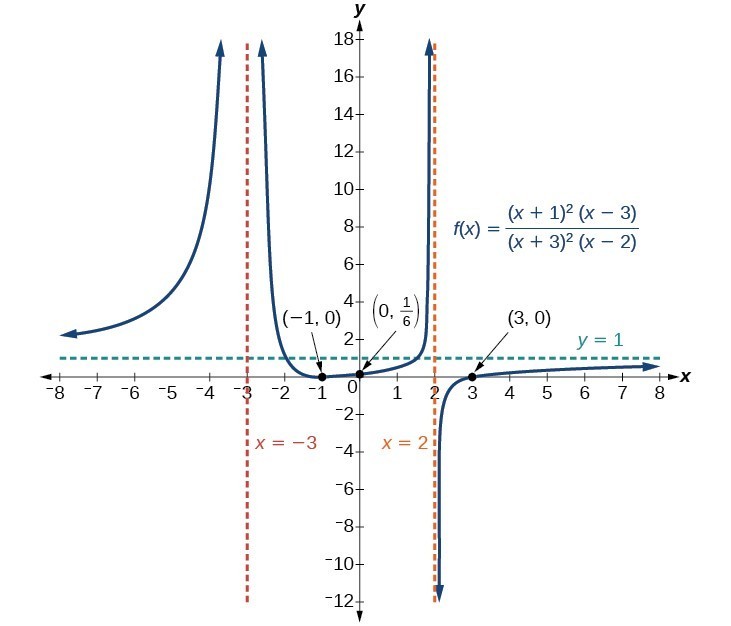
- At the [latex]x[/latex]-intercept [latex]x=-1[/latex] corresponding to the [latex]{\left(x+1\right)}^{2}[/latex] factor of the numerator, the graph bounces, consistent with the quadratic nature of the factor.
- At the [latex]x[/latex]-intercept [latex]x=3[/latex] corresponding to the [latex]\left(x - 3\right)[/latex] factor of the numerator, the graph passes through the axis as we would expect from a linear factor.
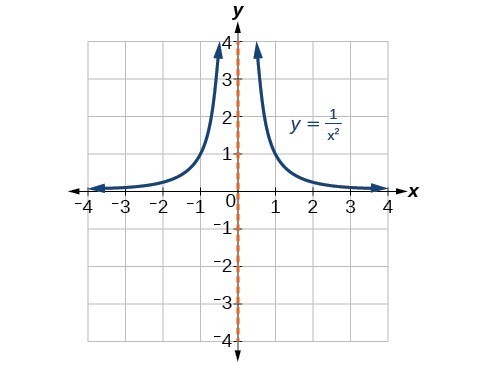
- At the vertical asymptote [latex]x=-3[/latex] corresponding to the [latex]{\left(x+3\right)}^{2}[/latex] factor of the denominator, the graph heads towards positive infinity on both sides of the asymptote, consistent with the behavior of the function [latex]f\left(x\right)=\frac{1}{{x}^{2}}[/latex].
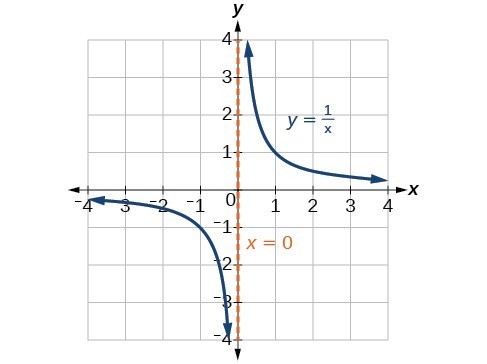
- At the vertical asymptote [latex]x=2[/latex], corresponding to the [latex]\left(x - 2\right)[/latex] factor of the denominator, the graph heads towards positive infinity on the left side of the asymptote and towards negative infinity on the right side, consistent with the behavior of the function [latex]f\left(x\right)=\frac{1}{x}[/latex].
How To: Given a rational function, sketch a graph.
- Evaluate the function at 0 to find the y-intercept.
- Factor the numerator and denominator.
- For factors in the numerator not common to the denominator, determine where each factor of the numerator is zero to find the [latex]x[/latex]-intercepts.
- Find the multiplicities of the [latex]x[/latex]-intercepts to determine the behavior of the graph at those points.
- For factors in the denominator, note the multiplicities of the zeros to determine the local behavior. For those factors not common to the numerator, find the vertical asymptotes by setting those factors equal to zero and then solve.
- For factors in the denominator common to factors in the numerator, find the removable discontinuities by setting those factors equal to 0 and then solve.
- Compare the degrees of the numerator and the denominator to determine the horizontal or slant asymptotes.
- Sketch the graph.
Example: Graphing a Rational Function
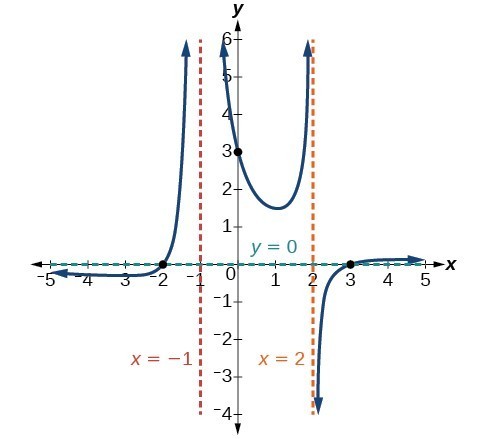
Sketch a graph of [latex]f\left(x\right)=\dfrac{\left(x+2\right)\left(x - 3\right)}{{\left(x+1\right)}^{2}\left(x - 2\right)}[/latex].Answer: We can start by noting that the function is already factored, saving us a step. Next, we will find the intercepts. Evaluating the function at zero gives the y-intercept:
[latex]f\left(0\right)=\frac{\left(0+2\right)\left(0 - 3\right)}{{\left(0+1\right)}^{2}\left(0 - 2\right)}=3[/latex]
To find the [latex]x[/latex]-intercepts, we determine when the numerator of the function is zero. Setting each factor equal to zero, we find [latex]x[/latex]-intercepts at [latex]x=-2[/latex] and [latex]x=3[/latex]. At each, the behavior will be linear (multiplicity 1), with the graph passing through the intercept. We have a [latex]y[/latex]-intercept at [latex]\left(0,3\right)[/latex] and x-intercepts at [latex]\left(-2,0\right)[/latex] and [latex]\left(3,0\right)[/latex]. To find the vertical asymptotes, we determine when the denominator is equal to zero. This occurs when [latex]x+1=0[/latex] and when [latex]x - 2=0[/latex], giving us vertical asymptotes at [latex]x=-1[/latex] and [latex]x=2[/latex]. There are no common factors in the numerator and denominator. This means there are no removable discontinuities. Finally, the degree of denominator is larger than the degree of the numerator, telling us this graph has a horizontal asymptote at [latex]y=0[/latex]. To sketch the graph, we might start by plotting the three intercepts. Since the graph has no [latex]x[/latex]-intercepts between the vertical asymptotes, and the [latex]y[/latex]-intercept is positive, we know the function must remain positive between the asymptotes, letting us fill in the middle portion of the graph.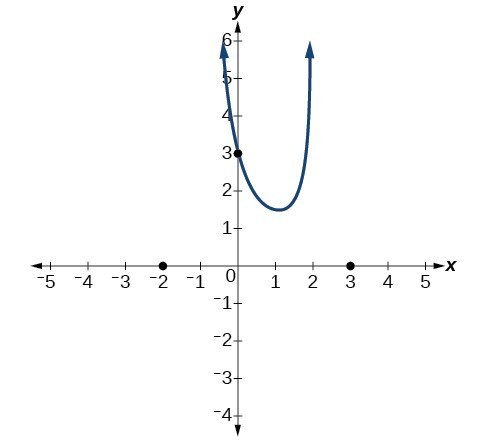 The factor associated with the vertical asymptote at [latex]x=-1[/latex] was squared, so we know the behavior will be the same on both sides of the asymptote. The graph heads toward positive infinity as the inputs approach the asymptote on the right, so the graph will head toward positive infinity on the left as well.
For the vertical asymptote at [latex]x=2[/latex], the factor was not squared, so the graph will have opposite behavior on either side of the asymptote. After passing through the [latex]x[/latex]-intercepts, the graph will then level off toward an output of zero, as indicated by the horizontal asymptote.
The factor associated with the vertical asymptote at [latex]x=-1[/latex] was squared, so we know the behavior will be the same on both sides of the asymptote. The graph heads toward positive infinity as the inputs approach the asymptote on the right, so the graph will head toward positive infinity on the left as well.
For the vertical asymptote at [latex]x=2[/latex], the factor was not squared, so the graph will have opposite behavior on either side of the asymptote. After passing through the [latex]x[/latex]-intercepts, the graph will then level off toward an output of zero, as indicated by the horizontal asymptote.
Try It
Given the function [latex]f\left(x\right)=\dfrac{{\left(x+2\right)}^{2}\left(x - 2\right)}{2{\left(x - 1\right)}^{2}\left(x - 3\right)}[/latex], use the characteristics of polynomials and rational functions to describe its behavior and sketch the function.Answer: Horizontal asymptote at [latex]y=\frac{1}{2}[/latex]. Vertical asymptotes at [latex]x=1[/latex] and [latex]x=3[/latex]. [latex]y[/latex]-intercept at [latex]\left(0,\frac{4}{3}.\right)[/latex]
x-intercepts at [latex]\left(2,0\right) \text{ and }\left(-2,0\right)[/latex]. [latex]\left(-2,0\right)[/latex] is a zero with multiplicity 2, and the graph bounces off the [latex]x[/latex]-axis at this point. [latex]\left(2,0\right)[/latex] is a single zero and the graph crosses the axis at this point.
 [embed]
what characteristics were used in the second example above?
In the "Try another version" of the above question, try discerning the correct graphs by examining possible horizontal (or slant) asymptotes of each type, then by checking the behavior of each graph around the vertical asymptotes. The horizontal (or slant) asymptote depends on the ratio of leading terms in the numerator and denominator.- If the degree of the numerator is less than the degree of the denominator, the horizontal asymptote is the line [latex]y=0[/latex].
- If the degree of the numerator is exactly one greater than the degree of the denominator, the graph has a slant asymptote.
- If the degree of the numerator is the same as the degree of the denominator, the horizontal asymptote will be the line [latex]y=c[/latex], where [latex]c[/latex] represents the value of the ratio of the leading coefficients of the numerator and denominator.
- A zero in the denominator of even multiplicity will cause the function value to increase or decrease in the same manner on either side of the vertical asymptote.
- A zero in the denominator of odd multiplicity will cause the function value to increase or decrease in opposite manner on either side of the vertical asymptote.
Writing Rational Functions
Now that we have analyzed the equations for rational functions and how they relate to a graph of the function, we can use information given by a graph to write the function. A rational function written in factored form will have an [latex]x[/latex]-intercept where each factor of the numerator is equal to zero. (An exception occurs in the case of a removable discontinuity.) As a result, we can form a numerator of a function whose graph will pass through a set of [latex]x[/latex]-intercepts by introducing a corresponding set of factors. Likewise, because the function will have a vertical asymptote where each factor of the denominator is equal to zero, we can form a denominator that will produce the vertical asymptotes by introducing a corresponding set of factors.A General Note: Writing Rational Functions from Intercepts and Asymptotes
If a rational function has [latex]x[/latex]-intercepts at [latex]x={x}_{1}, {x}_{2}, ..., {x}_{n}[/latex], vertical asymptotes at [latex]x={v}_{1},{v}_{2},\dots ,{v}_{m}[/latex], and no [latex]{x}_{i}=\text{any }{v}_{j}[/latex], then the function can be written in the form:[latex]f\left(x\right)=a\frac{{\left(x-{x}_{1}\right)}^{{p}_{1}}{\left(x-{x}_{2}\right)}^{{p}_{2}}\cdots {\left(x-{x}_{n}\right)}^{{p}_{n}}}{{\left(x-{v}_{1}\right)}^{{q}_{1}}{\left(x-{v}_{2}\right)}^{{q}_{2}}\cdots {\left(x-{v}_{m}\right)}^{{q}_{n}}}[/latex]
where the powers [latex]{p}_{i}[/latex] or [latex]{q}_{i}[/latex] on each factor can be determined by the behavior of the graph at the corresponding intercept or asymptote, and the stretch factor [latex]a[/latex] can be determined given a value of the function other than the [latex]x[/latex]-intercept or by the horizontal asymptote if it is nonzero.what do the subscripts in the example above indicate?
The above example uses an abstract form to help define a rational function. We've seen these before. A linear function can be written in the form [latex]f(x)=mx+b[/latex], and a quadratic function can be written in the form [latex]f(x)=ax^2+bx+c[/latex]. A quadratic can also be written in the form of a polynomial as [latex]p(x)=a(x-r_{1})(x-r_{2})[/latex], where [latex]a[/latex] represents the leading coefficient and [latex]r_{1}[/latex] and [latex]r_{2}[/latex] are the roots, or zeros of the function. Instead of writing "[latex]r_{1}[/latex] and [latex]r_{2}[/latex]," we could use some notational shorthand and simply write, "the [latex]r_{n}[/latex]" to indicate them both at once. That's the same as saying that the number of roots present include [latex]r_{1}, r_{2}, \ldots, r_{n}[/latex] for [latex]n[/latex] total roots. In the definition above, to say that "no [latex]x_{i}=\text{ any } v_{j}[/latex]" is to say that there are no common factors in the numerator and denominator. In other words, the roots in the numerator and the vertical asymptotes in the denominator can only be counted in factored and reduced form.How To: Given a graph of a rational function, write the function.
- Determine the factors of the numerator. Examine the behavior of the graph at the x-intercepts to determine the zeroes and their multiplicities. (This is easy to do when finding the "simplest" function with small multiplicities—such as 1 or 3—but may be difficult for larger multiplicities—such as 5 or 7, for example.)
- Determine the factors of the denominator. Examine the behavior on both sides of each vertical asymptote to determine the factors and their powers.
- Use any clear point on the graph to find the stretch factor.
Example: Writing a Rational Function from Intercepts and Asymptotes
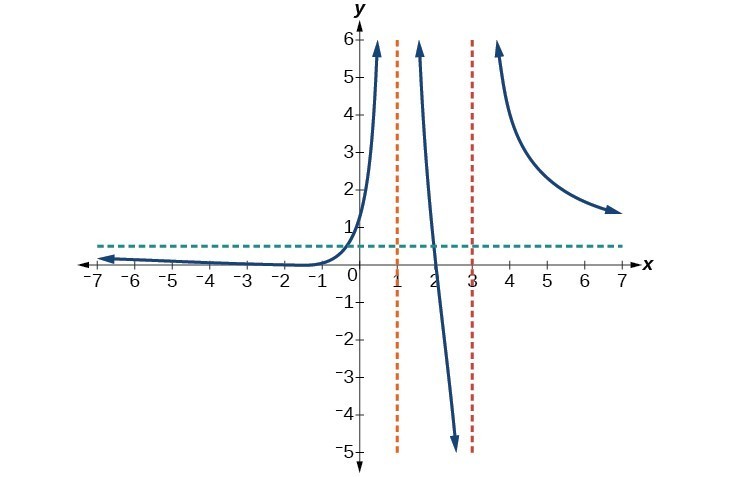
Write an equation for the rational function below.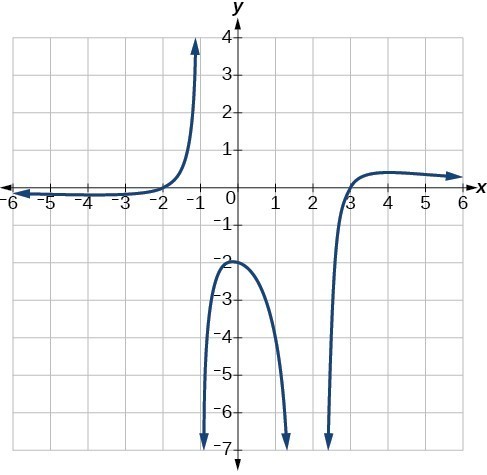
Answer:
The graph appears to have [latex]x[/latex]-intercepts at [latex]x=-2[/latex] and [latex]x=3[/latex]. At both, the graph passes through the intercept, suggesting linear factors. The graph has two vertical asymptotes. The one at [latex]x=-1[/latex] seems to exhibit the basic behavior similar to [latex]\frac{1}{x}[/latex], with the graph heading toward positive infinity on one side and heading toward negative infinity on the other. The asymptote at [latex]x=2[/latex] is exhibiting a behavior similar to [latex]\frac{1}{{x}^{2}}[/latex], with the graph heading toward negative infinity on both sides of the asymptote.
 We can use this information to write a function of the form
[latex]f\left(x\right)=a\dfrac{\left(x+2\right)\left(x - 3\right)}{\left(x+1\right){\left(x - 2\right)}^{2}}[/latex].
To find the stretch factor, we can use another clear point on the graph, such as the [latex]y[/latex]-intercept [latex]\left(0,-2\right)[/latex].[latex]\begin{align}-2&=a\dfrac{\left(0+2\right)\left(0 - 3\right)}{\left(0+1\right){\left(0 - 2\right)}^{2}} \\[1mm] -2&=a\frac{-6}{4} \\[1mm] a=\frac{-8}{-6}=\frac{4}{3} \end{align}[/latex]
This gives us a final function of [latex]f\left(x\right)=\dfrac{4\left(x+2\right)\left(x - 3\right)}{3\left(x+1\right){\left(x - 2\right)}^{2}}[/latex].Using a point on the graph to write the equation of the graph
Note in the example above that we used a point on the graph to help write the equation of the graph. In doing so, we used the important concept that any point contained on the graph of a function satisfies the equation of the function (that is, substituting both input and output values into the function equation will result in a true statement). This concept applies to any function we study. If the function can be graphed in the real plane, it has a set of input [latex]x[/latex] values and a set of corresponding output [latex]f(x)[/latex] values, and each corresponding pair is given by [latex]\left(x, f(x)\right)[/latex]. This correspondence allows us to substitute any [latex]x[/latex] to find its corresponding [latex]f(x)[/latex] and vice versa. It also allows us to substitute both input and output into any function equation in order to solve for a missing third value, such as the leading coefficient [latex]a[/latex] in the example above.Try it
[embed]Licenses & Attributions
CC licensed content, Original
- Revision and Adaptation. Provided by: Lumen Learning License: CC BY: Attribution.
CC licensed content, Shared previously
- Question ID 1802. Authored by: Lippman,David. License: CC BY: Attribution. License terms: IMathAS Community License CC-BY + GPL.
- College Algebra. Provided by: OpenStax Authored by: Abramson, Jay et al.. Located at: https://openstax.org/books/college-algebra/pages/1-introduction-to-prerequisites. License: CC BY: Attribution. License terms: Download for free at http://cnx.org/contents/[email protected].
- Question ID 129075. Authored by: Day, Alyson. License: CC BY: Attribution. License terms: IMathAS Community License CC-BY + GPL.
- Ex: Match Equations of Rational Functions to Graphs . Authored by: James Sousa (Mathispower4u.com) for Lumen Learning. License: CC BY: Attribution.
