Graphs of Quadratic Functions
Parts of a Parabola
The graph of a quadratic function is a parabola, and its parts provide valuable information about the function.Learning Objectives
Describe the parts and features of parabolasKey Takeaways
Key Points
- The graph of a quadratic function is a U-shaped curve called a parabola.
- The sign on the coefficient [latex]a[/latex] of the quadratic function affects whether the graph opens up or down. If [latex]a<0[/latex], the graph makes a frown (opens down) and if [latex]a>0[/latex] then the graph makes a smile (opens up).
- The extreme point ( maximum or minimum ) of a parabola is called the vertex, and the axis of symmetry is a vertical line that passes through the vertex.
- The x-intercepts are the points at which the parabola crosses the x-axis. If they exist, the x-intercepts represent the zeros, or roots, of the quadratic function.
Key Terms
- vertex: The point at which a parabola changes direction, corresponding to the minimum or maximum value of the quadratic function.
- axis of symmetry: A vertical line drawn through the vertex of a parabola around which the parabola is symmetric.
- zeros: In a given function, the values of [latex]x[/latex] at which [latex]y=0[/latex], also called roots.
 Parabola : The graph of a quadratic function is a parabola.
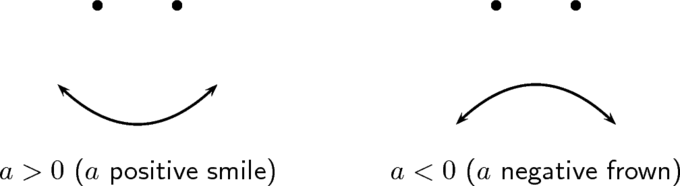 Direction of Parabolas: The sign on the coefficient [latex]a[/latex] determines the direction of the parabola.
Features of Parabolas
Parabolas have several recognizable features that characterize their shape and placement on the Cartesian plane.Vertex
One important feature of the parabola is that it has an extreme point, called the vertex. If the parabola opens up, the vertex represents the lowest point on the graph, or the minimum value of the quadratic function. If the parabola opens down, the vertex represents the highest point on the graph, or the maximum value. In either case, the vertex is a turning point on the graph.Axis of Symmetry
Parabolas also have an axis of symmetry, which is parallel to the y-axis. The axis of symmetry is a vertical line drawn through the vertex.[latex]y[/latex]-intercept
The y-intercept is the point at which the parabola crosses the y-axis. There cannot be more than one such point, for the graph of a quadratic function. If there were, the curve would not be a function, as there would be two [latex]y[/latex] values for one [latex]x[/latex] value, at zero.[latex]x[/latex]-intercepts
The x-intercepts are the points at which the parabola crosses the x-axis. If they exist, the x-intercepts represent the zeros, or roots, of the quadratic function, the values of [latex]x[/latex] at which [latex]y=0[/latex]. There may be zero, one, or two [latex]x[/latex]-intercepts. The number of [latex]x[/latex]-intercepts varies depending upon the location of the graph (see the diagram below). Possible [latex]x[/latex]-intercepts: A parabola can have no x-intercepts, one x-intercept, or two x-intercepts
Recall that if the quadratic function is set equal to zero, then the result is a quadratic equation. The solutions to the equation are called the roots of the function. These are the same roots that are observable as the [latex]x[/latex]-intercepts of the parabola.
Notice that, for parabolas with two [latex]x[/latex]-intercepts, the vertex always falls between the roots. Due to the fact that parabolas are symmetric, the [latex]x[/latex]-coordinate of the vertex is exactly in the middle of the [latex]x[/latex]-coordinates of the two roots.A Graphical Interpretation of Quadratic Solutions
The roots of a quadratic function can be found algebraically or graphically.Learning Objectives
Describe the solutions to a quadratic equation as the points where the parabola crosses the x-axisKey Takeaways
Key Points
- The roots of a quadratic function can be found algebraically with the quadratic formula, and graphically by making observations about its parabola.
- The solutions, or roots, of a given quadratic equation are the same as the zeros, or [latex]x[/latex]-intercepts, of the graph of the corresponding quadratic function.
Key Terms
- zeros: In a given function, the values of [latex]x[/latex] at which [latex]y = 0[/latex], also called roots.
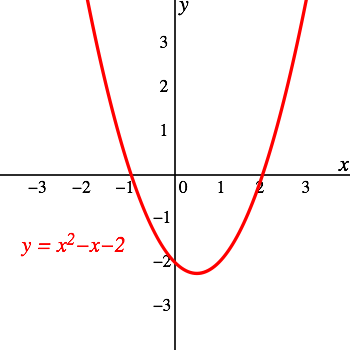 Graph of the quadratic function [latex]f(x) = x^2 - x - 2[/latex]: Graph showing the parabola on the Cartesian plane, including the points where it crosses the x-axis.
Example
Find the roots of the quadratic function [latex]f(x) = x^2 - 4x + 4[/latex]. Solve graphically and algebraically. The graph of [latex]f(x) = x^2 - 4x + 4[/latex].: The graph of the above function, with the vertex labeled at [latex](2, 1)[/latex].
Graphing Quadratic Equations in Vertex Form
The vertex form of a quadratic function lets its vertex be found easily.Learning Objectives
Explain the meanings of the constants [latex]a[/latex], [latex]h[/latex], and [latex]k[/latex] for a quadratic equation in vertex formKey Takeaways
Key Points
- An important form of a quadratic function is vertex form: [latex]f(x) = a(x-h)^2 + k[/latex]
- When written in vertex form, it is easy to see the vertex of the parabola at [latex](h, k)[/latex].
- It is easy to convert from vertex form to standard form.
- It is more difficult, but still possible, to convert from standard form to vertex form. The process involves a technique called completing the square.
Key Terms
- constant: An identifier that is bound to an invariant value.
- vertex: A point on the curve with a local minimum or maximum of curvature.
- quadratic: A polynomial of degree two.
Converting From Vertex Form to Standard Form
If you want to convert a quadratic in vertex form to one in standard form, simply multiply out the square and combine like terms. For example, the quadratic [latex-display]y=(x-2)^2+1[/latex-display] Can be rewritten as follows: [latex-display]\begin{align} y&=(x-2)(x-2)+1 \\ &=x^2-2x-2x+4+1 \\ &=x^2-4x+5 \end{align}[/latex-display]Converting From Standard Form to Vertex Form
It is more difficult to convert from standard form to vertex form. The process is called "completing the square."Conversion When [latex]a=1[/latex]
Consider the following example: suppose you want to write [latex]y=x^2+4x+6[/latex] in vertex form. Note that the coefficient on [latex]x^2[/latex] (the one we call [latex]a[/latex]) is [latex]1[/latex]. When this is the case, we look at the coefficient on [latex]x[/latex] (the one we call [latex]b[/latex]) and take half of it. Then we square that number. Thus for this example, we divide [latex]4[/latex] by [latex]2[/latex] to obtain [latex]2[/latex] and then square it to obtain [latex]4[/latex]. We then both add and subtract this number as follows: [latex-display]y=(x^2+4x+4)+6-4[/latex-display] Note that we both added and subtracted 4, so we didn't actually change our function. Now the expression in the parentheses is a square; we can write [latex]y=(x+2)^2+2.[/latex] Our equation is now in vertex form and we can see that the vertex is [latex](-2,2).[/latex]Conversion When [latex]a \neq 1[/latex]
It is slightly more complicated to convert standard form to vertex form when the coefficient [latex]a[/latex] is not equal to [latex]1[/latex]. We can still use the technique, but must be careful to first factor out the [latex]a[/latex] as in the following example: Consider [latex]y=2x^2+12x+5. [/latex] We factor out the coefficient [latex]2[/latex] from the first two terms, writing this as: [latex-display]y=2(x^2+6x) + 5[/latex-display] We then complete the square within the parentheses. Note that half of [latex]6[/latex] is [latex]3[/latex] and [latex]3^2=9[/latex]. So we add and subtract [latex]9[/latex] within the parentheses, obtaining: [latex-display]y=2(x^2+6x+9-9)+5[/latex-display] We can then finish the calculation as follows: [latex-display]\begin{align} y&=2((x+3)^2-9)+5 \\ &=2(x+3)^2-18+5 \\ &=(x+3)^2-13 \end{align}[/latex-display] So the vertex of this parabola is [latex](-3,-13).[/latex]Graphing Quadratic Equations In Standard Form
A quadratic function is a polynomial function of the form [latex]y=ax^2+bx+c[/latex].Learning Objectives
Explain the meanings of the constants [latex]a[/latex], [latex]b[/latex], and [latex]c[/latex] for a quadratic equation in standard formKey Takeaways
Key Points
- The graph of a quadratic function is a parabola whose axis of symmetry is parallel to the [latex]y[/latex]-axis.
- The coefficients [latex]a, b,[/latex] and [latex]c[/latex] in the equation [latex]y=ax^2+bx+c[/latex] control various facets of what the parabola looks like when graphed.
Key Terms
- vertex: The maximum or minimum of a quadratic function.
- parabola: The shape formed by the graph of a quadratic function.
- quadratic: A polynomial of degree two.
 The graph of [latex]y=x^2-4x+3[/latex] : The graph of any quadratic equation is always a parabola.
Coefficients and Graphs of Quadratic Function
Each coefficient in a quadratic function in standard form has an impact on the shape and placement of the function's graph.Coefficient of [latex]x^2[/latex], [latex]a[/latex]
The coefficient [latex]a[/latex] controls the speed of increase (or decrease) of the quadratic function from the vertex. A larger, positive [latex]a[/latex] makes the function increase faster and the graph appear thinner. The coefficient [latex]a[/latex] controls the speed of increase of the parabola.: The black curve is [latex]y=4x^2[/latex] while the blue curve is [latex]y=3x^2.[/latex] The black curve appears thinner because its coefficient [latex]a[/latex] is bigger than that of the blue curve.
 Quadratics either open upward or downward: The blue parabola is the graph of [latex]y=3x^2.[/latex] It opens upward since [latex]a=3>0.[/latex] The black parabola is the graph of [latex]y=-3x^2.[/latex] It opens downward since [latex]a=-3<0.[/latex].
The Axis of Symmetry
The coefficients [latex]b[/latex] and [latex]a[/latex] together control the axis of symmetry of the parabola and the [latex]x[/latex]-coordinate of the vertex. The axis of symmetry for a parabola is given by: [latex-display]x=-\dfrac{b}{2a}[/latex-display] For example, consider the parabola [latex]y=2x^2-4x+4 [/latex] shown below. Because [latex]a=2[/latex] and [latex]b=-4,[/latex] the axis of symmetry is: [latex-display]x=-\frac{-4}{2\cdot 2} = 1[/latex-display] The vertex also has [latex]x[/latex] coordinate [latex]1[/latex]. The graph of [latex]y=2x^2-4x+4.[/latex]: The axis of symmetry is a vertical line parallel to the y-axis at [latex]x=1[/latex].
The [latex]y[/latex]-intercept of the Parabola
The coefficient [latex]c[/latex] controls the height of the parabola. More specifically, it is the point where the parabola intercepts the y-axis. The point [latex](0,c)[/latex] is the [latex]y[/latex] intercept of the parabola. Note that the parabola above has [latex]c=4[/latex] and it intercepts the [latex]y[/latex]-axis at the point [latex](0,4).[/latex]Licenses & Attributions
CC licensed content, Shared previously
- Curation and Revision. Authored by: Boundless.com. License: Public Domain: No Known Copyright.
CC licensed content, Specific attribution
- Free High School Science Texts Project, Functions and graphs: The parabola (Grade 10). . Provided by: OpenStax Located at: https://cnx.org/contents/7dfb283a-a69b-4490-b63c-db123bebe94b@1. License: CC BY: Attribution.
- Quadratic function. Provided by: Wikipedia License: CC BY-SA: Attribution-ShareAlike.
- Precalculus, Quadratic Functions. Provided by: OpenStax Located at: https://cnx.org/contents/7a2c53a4-019a-485d-b0fa-f4451797cb34@10. License: CC BY: Attribution.
- Precalculus, Quadratic Functions. Provided by: OpenStax License: CC BY-SA: Attribution-ShareAlike.
- Free High School Science Texts Project, Functions and graphs: The parabola (Grade 10). . Provided by: OpenStax Located at: https://cnx.org/contents/7dfb283a-a69b-4490-b63c-db123bebe94b@1. License: CC BY-SA: Attribution-ShareAlike.
- Precalculus, Quadratic Functions. Provided by: OpenStax License: CC BY: Attribution.
- Quadratic function. Provided by: Wikipedia License: CC BY-SA: Attribution-ShareAlike.
- Precalculus, Quadratic Functions. Provided by: OpenStax Located at: https://cnx.org/contents/7a2c53a4-019a-485d-b0fa-f4451797cb34@10. License: CC BY: Attribution.
- Completing the square. Provided by: Wikipedia License: CC BY-SA: Attribution-ShareAlike.
- Quadratic function. Provided by: Wikipedia License: CC BY-SA: Attribution-ShareAlike.
- constant. Provided by: Wiktionary License: CC BY-SA: Attribution-ShareAlike.
- vertex. Provided by: Wiktionary License: CC BY-SA: Attribution-ShareAlike.
- quadratic. Provided by: Wiktionary License: CC BY-SA: Attribution-ShareAlike.
- Precalculus, Quadratic Functions. Provided by: OpenStax Located at: https://cnx.org/contents/7a2c53a4-019a-485d-b0fa-f4451797cb34@10. License: CC BY-SA: Attribution-ShareAlike.
- Free High School Science Texts Project, Functions and graphs: The parabola (Grade 10). . Provided by: OpenStax License: CC BY-SA: Attribution-ShareAlike.
- Precalculus, Quadratic Functions. Provided by: OpenStax Located at: https://cnx.org/contents/7a2c53a4-019a-485d-b0fa-f4451797cb34@10. License: CC BY: Attribution.
- Quadratic function. Provided by: Wikipedia Located at: https://en.wikipedia.org/wiki/Quadratic_function#/media/File:Polynomialdeg2.svg. License: CC BY-SA: Attribution-ShareAlike.
- Precalculus, Quadratic Functions. Provided by: OpenStax License: CC BY: Attribution.
- Quadratic function. Provided by: Wikipedia License: CC BY-SA: Attribution-ShareAlike.
- parabola. Provided by: Wiktionary License: CC BY-SA: Attribution-ShareAlike.
- vertex. Provided by: Wiktionary License: CC BY-SA: Attribution-ShareAlike.
- quadratic. Provided by: Wiktionary License: CC BY-SA: Attribution-ShareAlike.
- Precalculus, Quadratic Functions. Provided by: OpenStax Located at: https://cnx.org/contents/7a2c53a4-019a-485d-b0fa-f4451797cb34@10. License: CC BY-SA: Attribution-ShareAlike.
- Free High School Science Texts Project, Functions and graphs: The parabola (Grade 10). . Provided by: OpenStax License: CC BY-SA: Attribution-ShareAlike.
- Precalculus, Quadratic Functions. Provided by: OpenStax Located at: https://cnx.org/contents/7a2c53a4-019a-485d-b0fa-f4451797cb34@10. License: CC BY: Attribution.
- Quadratic function. Provided by: Wikipedia License: CC BY-SA: Attribution-ShareAlike.
- Precalculus, Quadratic Functions. Provided by: OpenStax Located at: https://cnx.org/contents/7a2c53a4-019a-485d-b0fa-f4451797cb34@10. License: CC BY: Attribution.
- Original figure by Mark Woodard. Licensed CC BY-SA 4.0. Provided by: Mark Woodard License: CC BY-SA: Attribution-ShareAlike.
- Original figure by Mark Woodard. Licensed CC BY-SA 4.0. Provided by: Mark Woodard License: CC BY-SA: Attribution-ShareAlike.
- Original figure by Mark Woodard. Licensed CC BY-SA 4.0. Provided by: Mark Woodard License: CC BY-SA: Attribution-ShareAlike.
- Original figure by Mark Woodard. Licensed CC BY-SA 4.0. Provided by: Mark Woodard License: CC BY-SA: Attribution-ShareAlike.
