
Graph Hyperbolas
Learning Outcomes
- Graph a hyperbola centered at the origin.
- Graph a hyperbola not centered at the origin.
How To: Given a standard form equation for a hyperbola centered at [latex]\left(0,0\right)[/latex], sketch the graph.
- Determine which of the standard forms applies to the given equation.
- Use the standard form identified in Step 1 to determine the position of the transverse axis; coordinates for the vertices, co-vertices, and foci; and the equations for the asymptotes.
- If the equation is in the form [latex]\dfrac{{x}^{2}}{{a}^{2}}-\dfrac{{y}^{2}}{{b}^{2}}=1[/latex], then
- the transverse axis is on the x-axis
- the coordinates of the vertices are [latex]\left(\pm a,0\right)[/latex]
- the coordinates of the co-vertices are [latex]\left(0,\pm b\right)[/latex]
- the coordinates of the foci are [latex]\left(\pm c,0\right)[/latex]
- the equations of the asymptotes are [latex]y=\pm \frac{b}{a}x[/latex]
- If the equation is in the form [latex]\dfrac{{y}^{2}}{{a}^{2}}-\dfrac{{x}^{2}}{{b}^{2}}=1[/latex], then
- the transverse axis is on the y-axis
- the coordinates of the vertices are [latex]\left(0,\pm a\right)[/latex]
- the coordinates of the co-vertices are [latex]\left(\pm b,0\right)[/latex]
- the coordinates of the foci are [latex]\left(0,\pm c\right)[/latex]
- the equations of the asymptotes are [latex]y=\pm \frac{a}{b}x[/latex]
- If the equation is in the form [latex]\dfrac{{x}^{2}}{{a}^{2}}-\dfrac{{y}^{2}}{{b}^{2}}=1[/latex], then
- Solve for the coordinates of the foci using the equation [latex]c=\pm \sqrt{{a}^{2}+{b}^{2}}[/latex].
- Plot the vertices, co-vertices, foci, and asymptotes in the coordinate plane, and draw a smooth curve to form the hyperbola.
Example: Graphing a Hyperbola Centered at (0, 0) Given an Equation in Standard Form
Graph the hyperbola given by the equation [latex]\dfrac{{y}^{2}}{64}-\dfrac{{x}^{2}}{36}=1[/latex]. Identify and label the vertices, co-vertices, foci, and asymptotes.Answer: The standard form that applies to the given equation is [latex]\dfrac{{y}^{2}}{{a}^{2}}-\dfrac{{x}^{2}}{{b}^{2}}=1[/latex]. Thus, the transverse axis is on the y-axis The coordinates of the vertices are [latex]\left(0,\pm a\right)=\left(0,\pm \sqrt{64}\right)=\left(0,\pm 8\right)[/latex] The coordinates of the co-vertices are [latex]\left(\pm b,0\right)=\left(\pm \sqrt{36},\text{ }0\right)=\left(\pm 6,0\right)[/latex] The coordinates of the foci are [latex]\left(0,\pm c\right)[/latex], where [latex]c=\pm \sqrt{{a}^{2}+{b}^{2}}[/latex]. Solving for [latex]c[/latex] we have
[latex]\begin{align} c&=\pm \sqrt{{a}^{2}+{b}^{2}} \\ &=\pm \sqrt{64+36} \\ &=\pm \sqrt{100} \\ &=\pm 10 \end{align}[/latex]
Therefore, the coordinates of the foci are [latex]\left(0,\pm 10\right)[/latex] The equations of the asymptotes are[latex]\begin{align} y=\pm \frac{a}{b}x \\ y=\pm \frac{8}{6}x \\ y=\pm \frac{4}{3}x \end{align}[/latex]
Plot and label the vertices and co-vertices, and then sketch the central rectangle. Sides of the rectangle are parallel to the axes and pass through the vertices and co-vertices. Sketch and extend the diagonals of the central rectangle to show the asymptotes. The central rectangle and asymptotes provide the framework needed to sketch an accurate graph of the hyperbola. Label the foci and asymptotes, and draw a smooth curve to form the hyperbola.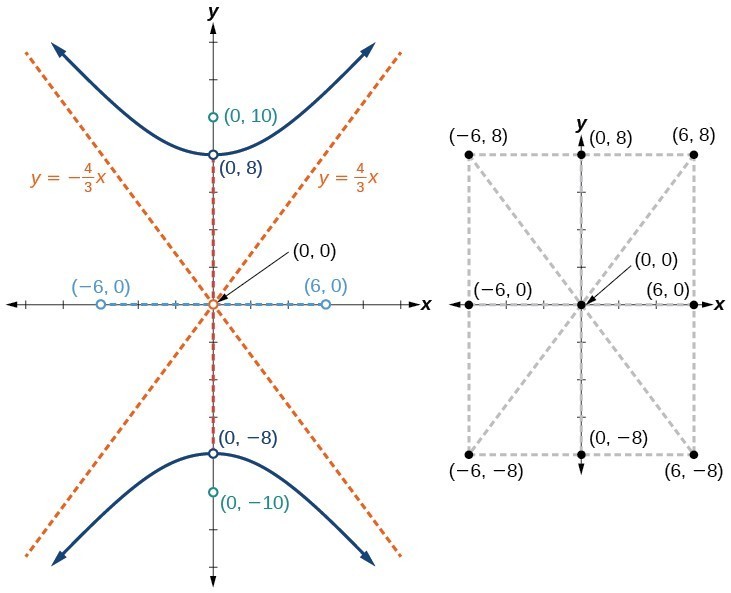
Try It
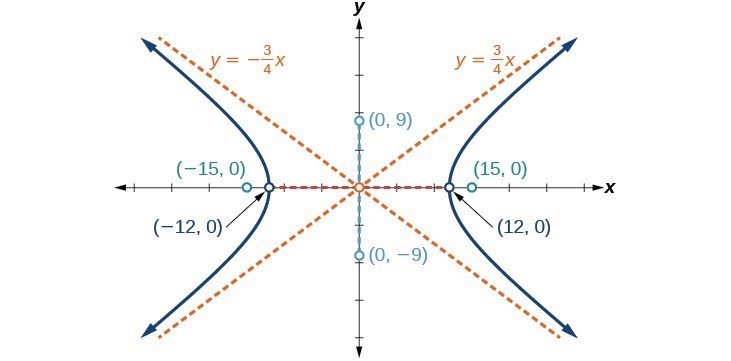
Graph the hyperbola given by the equation [latex]\dfrac{{x}^{2}}{144}-\dfrac{{y}^{2}}{81}=1[/latex]. Identify and label the vertices, co-vertices, foci, and asymptotes.Answer:
vertices: [latex]\left(\pm 12,0\right)[/latex]; co-vertices: [latex]\left(0,\pm 9\right)[/latex]; foci: [latex]\left(\pm 15,0\right)[/latex]; asymptotes: [latex]y=\pm \frac{3}{4}x[/latex];
Try It
Use an online graphing tool to plot the equation [latex]\dfrac{x^2}{a^2} - \dfrac{y^2}{b^2} = 1[/latex]. Adjust the values you use for [latex]a,b[/latex] to values between [latex] 1, 20[/latex]. Your task in this exercise is to graph a hyperbola and then calculate and add the following features to the graph:- vertices
- co-vertices
- foci
- asymptotes
Graphing Hyperbolas Not Centered at the Origin
Graphing hyperbolas centered at a point [latex]\left(h,k\right)[/latex] other than the origin is similar to graphing ellipses centered at a point other than the origin. We use the standard forms [latex]\dfrac{{\left(x-h\right)}^{2}}{{a}^{2}}-\dfrac{{\left(y-k\right)}^{2}}{{b}^{2}}=1[/latex] for horizontal hyperbolas, and [latex]\dfrac{{\left(y-k\right)}^{2}}{{a}^{2}}-\dfrac{{\left(x-h\right)}^{2}}{{b}^{2}}=1[/latex] for vertical hyperbolas. From these standard form equations we can easily calculate and plot key features of the graph: the coordinates of its center, vertices, co-vertices, and foci; the equations of its asymptotes; and the positions of the transverse and conjugate axes.tip for success
Writing the equation of a hyperbola not centered at the origin uses graph transformation techniques in the same way that writing the equation of an ellipse does. The center is represented by [latex]\left(h, k\right)[/latex] as it was in the ellipse. Look for similarities and differences in the construction of ellipses, hyperbolas, and parabolas to help you build your intuition about these objects.How To: Given a general form for a hyperbola centered at [latex]\left(h,k\right)[/latex], sketch the graph.
- Convert the general form to that standard form. Determine which of the standard forms applies to the given equation.
- Use the standard form identified in Step 1 to determine the position of the transverse axis; coordinates for the center, vertices, co-vertices, foci; and equations for the asymptotes.
- If the equation is in the form [latex]\dfrac{{\left(x-h\right)}^{2}}{{a}^{2}}-\dfrac{{\left(y-k\right)}^{2}}{{b}^{2}}=1[/latex], then
- the transverse axis is parallel to the x-axis
- the center is [latex]\left(h,k\right)[/latex]
- the coordinates of the vertices are [latex]\left(h\pm a,k\right)[/latex]
- the coordinates of the co-vertices are [latex]\left(h,k\pm b\right)[/latex]
- the coordinates of the foci are [latex]\left(h\pm c,k\right)[/latex]
- the equations of the asymptotes are [latex]y=\pm \frac{b}{a}\left(x-h\right)+k[/latex]
- If the equation is in the form [latex]\dfrac{{\left(y-k\right)}^{2}}{{a}^{2}}-\dfrac{{\left(x-h\right)}^{2}}{{b}^{2}}=1[/latex], then
- the transverse axis is parallel to the y-axis
- the center is [latex]\left(h,k\right)[/latex]
- the coordinates of the vertices are [latex]\left(h,k\pm a\right)[/latex]
- the coordinates of the co-vertices are [latex]\left(h\pm b,k\right)[/latex]
- the coordinates of the foci are [latex]\left(h,k\pm c\right)[/latex]
- the equations of the asymptotes are [latex]y=\pm \frac{a}{b}\left(x-h\right)+k[/latex]
- If the equation is in the form [latex]\dfrac{{\left(x-h\right)}^{2}}{{a}^{2}}-\dfrac{{\left(y-k\right)}^{2}}{{b}^{2}}=1[/latex], then
- Solve for the coordinates of the foci using the equation [latex]c=\pm \sqrt{{a}^{2}+{b}^{2}}[/latex].
- Plot the center, vertices, co-vertices, foci, and asymptotes in the coordinate plane and draw a smooth curve to form the hyperbola.
recall Complete the square
You will need to complete the square twice when rewriting the general form of a hyperbola in the same way you did with the ellipse. Here's the form to help you.Completing the Square
Given an expression of the form [latex]a\left(x^2+bx\right)[/latex], add [latex]\left(\dfrac{b}{2}\right)^2[/latex] inside the parentheses, then subtract [latex]a\left(\dfrac{b}{2}\right)^2[/latex] to counteract the change you made. If completing the square on one side of an equation, you may either subtract the value of [latex]a\left(\dfrac{b}{2}\right)^2[/latex] from that side, or add it to the other to maintain equality. Then factor the perfect square trinomial you created inside the original parentheses. Example [latex-display]\qquad a\left(x^2+bx\right)[/latex-display] [latex-display]=a\left(x^2+bx+ \left(\dfrac{b}{2}\right)^2\right)-a\left(\dfrac{b}{2}\right)^2[/latex-display] [latex-display]=a\left(x+ \dfrac{b}{2}\right)^2-a\left(\dfrac{b}{2}\right)^2[/latex-display]Example: Graphing a Hyperbola Centered at (h, k) Given an Equation in General Form
Graph the hyperbola given by the equation [latex]9{x}^{2}-4{y}^{2}-36x - 40y - 388=0[/latex]. Identify and label the center, vertices, co-vertices, foci, and asymptotes.Answer: Start by expressing the equation in standard form. Group terms that contain the same variable, and move the constant to the opposite side of the equation.
[latex]\left(9{x}^{2}-36x\right)-\left(4{y}^{2}+40y\right)=388[/latex]
Factor the leading coefficient of each expression.[latex]9\left({x}^{2}-4x\right)-4\left({y}^{2}+10y\right)=388[/latex]
Complete the square twice. Remember to balance the equation by adding the same constants to each side.[latex]9\left({x}^{2}-4x+4\right)-4\left({y}^{2}+10y+25\right)=388+9\cdot4 - 4\cdot25[/latex]
Rewrite as perfect squares.[latex]9{\left(x - 2\right)}^{2}-4{\left(y+5\right)}^{2}=324[/latex]
Divide both sides by the constant term to place the equation in standard form.[latex]\dfrac{{\left(x - 2\right)}^{2}}{36}-\dfrac{{\left(y+5\right)}^{2}}{81}=1[/latex]
The standard form that applies to the given equation is [latex]\dfrac{{\left(x-h\right)}^{2}}{{a}^{2}}-\dfrac{{\left(y-k\right)}^{2}}{{b}^{2}}=1[/latex], where [latex]{a}^{2}=36[/latex] and [latex]{b}^{2}=81[/latex], or [latex]a=6[/latex] and [latex]b=9[/latex]. Thus, the transverse axis is parallel to the x-axis. It follows that:the center of the ellipse is [latex]\left(h,k\right)=\left(2,-5\right)[/latex]
- the coordinates of the vertices are [latex]\left(h\pm a,k\right)=\left(2\pm 6,-5\right)[/latex], or [latex]\left(-4,-5\right)[/latex] and [latex]\left(8,-5\right)[/latex]
- the coordinates of the co-vertices are [latex]\left(h,k\pm b\right)=\left(2,-5\pm 9\right)[/latex], or [latex]\left(2,-14\right)[/latex] and [latex]\left(2,4\right)[/latex]
- the coordinates of the foci are [latex]\left(h\pm c,k\right)[/latex], where [latex]c=\pm \sqrt{{a}^{2}+{b}^{2}}[/latex]. Solving for [latex]c[/latex], we have
[latex]c=\pm \sqrt{36+81}=\pm \sqrt{117}=\pm 3\sqrt{13}[/latex]
Therefore, the coordinates of the foci are [latex]\left(2 - 3\sqrt{13},-5\right)[/latex] and [latex]\left(2+3\sqrt{13},-5\right)[/latex]. The equations of the asymptotes are [latex]y=\pm \frac{b}{a}\left(x-h\right)+k=\pm \frac{3}{2}\left(x - 2\right)-5[/latex]. Next, we plot and label the center, vertices, co-vertices, foci, and asymptotes and draw smooth curves to form the hyperbola.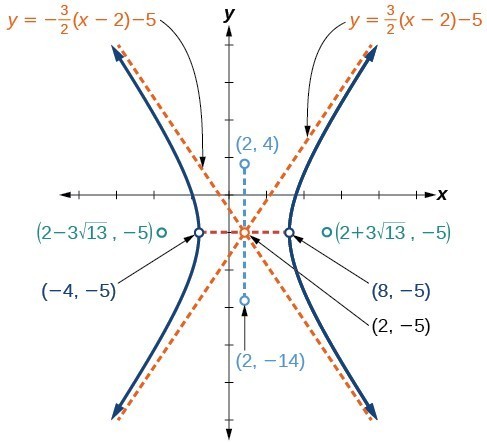
Try It
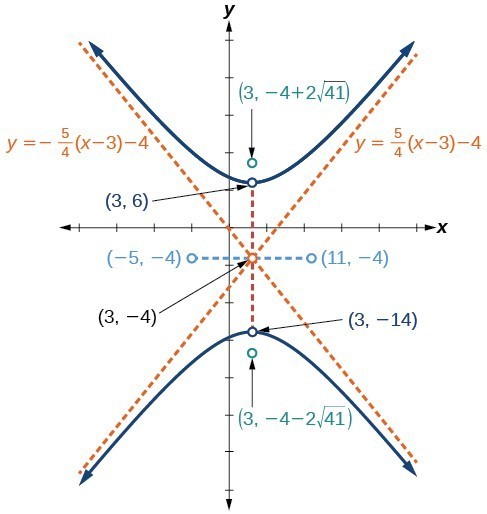
Graph the hyperbola given by the standard form of an equation [latex]\dfrac{{\left(y+4\right)}^{2}}{100}-\dfrac{{\left(x - 3\right)}^{2}}{64}=1[/latex]. Identify and label the center, vertices, co-vertices, foci, and asymptotes.Answer:
center: [latex]\left(3,-4\right)[/latex]; vertices: [latex]\left(3,-14\right)[/latex] and [latex]\left(3,6\right)[/latex]; co-vertices: [latex]\left(-5,-4\right)[/latex]; and [latex]\left(11,-4\right)[/latex]; foci: [latex]\left(3,-4 - 2\sqrt{41}\right)[/latex] and [latex]\left(3,-4+2\sqrt{41}\right)[/latex]; asymptotes: [latex]y=\pm \frac{5}{4}\left(x - 3\right)-4[/latex]
Try It
Using an online graphing calculator, plot a hyperbola not centered at the origin. The equation used to generate the graph is [latex]\dfrac{(x-h)^2}{a^2} - \dfrac{(y-k)^2}{b^2} = 1[/latex]. Adjust the values you use for [latex]a,b[/latex] to values between [latex] 1, 20[/latex], and the variables [latex]h,k[/latex] to numbers between [latex]10,10[/latex]. Your task in this exercise is to graph the hyperbola and then calculate and add the following features to the graph:- center
- vertices
- co-vertices
- foci
- asymptotes
Licenses & Attributions
CC licensed content, Original
- Revision and Adaptation. Provided by: Lumen Learning License: CC BY: Attribution.
- Graphing Hyperbolae Interactive. Authored by: Lumen Learning. Located at: https://www.desmos.com/calculator/du6j3vvisl. License: Public Domain: No Known Copyright.
- Graphing Hyperbolae - With Solutions Interactive. Authored by: Lumen Learning. Located at: https://www.desmos.com/calculator/enstg1igwo. License: Public Domain: No Known Copyright.
- Graphing Hyperbolae Not Centered at the Origin Interactive. Authored by: Lumen Learning. Located at: https://www.desmos.com/calculator/r307oiry1a. License: Public Domain: No Known Copyright.
- Graphing Hyperbolae Not Centered at the Origin - Solutions Interactive. Authored by: Lumen Learning. Located at: https://www.desmos.com/calculator/jilkpkpse1. License: Public Domain: No Known Copyright.
CC licensed content, Shared previously
- College Algebra. Provided by: OpenStax Authored by: Abramson, Jay et al.. License: CC BY: Attribution. License terms: Download for free at http://cnx.org/contents/[email protected].
- Question ID 65294. Authored by: Roberts,Janet. License: CC BY: Attribution. License terms: IMathAS Community License CC-BY+GPL.
CC licensed content, Specific attribution
- Precalculus. Provided by: OpenStax Authored by: OpenStax College. Located at: https://cnx.org/contents/[email protected]:1/Preface. License: CC BY: Attribution.
